NPK Ratio Comparison: Choosing Between Common Fertilizer Analyses
A side-by-side comparison of common NPK fertilizer analyses, their concentration differences, and how to choose between them without assuming a universal dosage.

Quick Answer
NPK numbers describe fertilizer analysis rather than a universal application dose. Balanced analyses such as 10-10-10, 19-19-19, and 20-20-20 contain equal proportions of their three primary nutrient components, while 10-26-26 contains proportionally less nitrogen and more phosphate and potash. Choose between them based on plant requirements, growing conditions, application method, and the specific product label.
The Problem
Fertilizer labels use number combinations such as 10-10-10, 19-19-19, 20-20-20, and 10-26-26, making it difficult to understand whether a higher number means a better product or a different application rate. This guide explains what the analyses mean and how to compare them without treating the NPK ratio as a universal dosage.
When to Use This Tool
Use this guide when comparing fertilizer products, interpreting NPK numbers, evaluating a possible substitution, or deciding what additional information is needed before calculating an application amount.
Who is this for?
- Home gardeners comparing fertilizer products before buying
- Houseplant owners learning how fertilizer analyses differ
- Vegetable and flower gardeners comparing nutrient formulations
- Lawn and turf gardeners evaluating fertilizer analyses
- Gardeners calculating equivalent nutrient concentrations between products
Application Reference
| Context | Guideline |
|---|---|
| pots | Follow the specific product label and plant requirements; the NPK ratio alone does not determine a universal container dose. |
| garden | Follow the specific product label, application method, and plant or crop requirements; the NPK ratio alone does not determine a universal garden dose. |
Recommended next actions
Next Best Actions
Use fertilizer guidance with calculators, plant profiles, and related care articles.
Fertilizer Guide
NPK 19-19-19 for Houseplants: Safe Dosage & Dilution Guide
A balanced water-soluble fertilizer containing equal labeled proportions of nitrogen, phosphate, and potash.
Calculator
Plant Fertilizer Calculator: Right Dose for Every Plant
Calculate the exact fertilizer dose and feeding schedule for your plant based on species, pot size, growth stage, and season.
Fertilizer Guide
Fertilizer Burn on Houseplants: Symptoms & Fast Fixes
How to identify, treat, and prevent fertilizer burn in houseplants and garden plants.
Fertilizer Guide
NPK 10-26-26 for Flowering Plants: Dosage & Use Guide
A low-nitrogen fertilizer analysis with higher labeled phosphate and potash proportions, used for flowering and fruiting applications when appropriate.
Fertilizer Guide
NPK 20-20-20 for Houseplants: Safe Dosage & Dilution
A balanced water-soluble fertilizer containing equal labeled proportions of nitrogen, phosphate, and potash.
Fertilizer Guide
Organic vs Synthetic Fertilizer: What's Best for Houseplants?
A side-by-side comparison of organic and synthetic fertilizers to help you choose the right option for your garden.
What Does an NPK Ratio Mean?
The three numbers on a conventional fertilizer label describe the product's nutrient analysis by weight. The first number represents total nitrogen (N), the second represents available phosphate expressed as P₂O₅, and the third represents soluble potash expressed as K₂O.
- Nitrogen (N): An essential nutrient involved in leaf and stem growth, chlorophyll formation, and many plant metabolic processes.
- Phosphate (P₂O₅): The phosphate value used in conventional fertilizer analysis and labeling; phosphorus is involved in energy transfer, root development, reproduction, and other plant processes.
- Potash (K₂O): The potassium value used in conventional fertilizer analysis and labeling; potassium contributes to water regulation, enzyme activity, and numerous physiological processes.
The ratio describes what the product contains. It does not, by itself, tell you which fertilizer a particular plant needs or how much to apply.
Analysis vs. Ratio: Two Different Ways to Read the Same Numbers
The term "NPK ratio" is used loosely. Strictly speaking, the three numbers on the bag are the analysis: the percentage of each nutrient component by weight. The ratio is the relationship between those numbers once they are simplified.
- 10-10-10, 19-19-19, and 20-20-20 all share a 1:1:1 ratio, but they have different analyses because their concentrations differ.
- 10-26-26 simplifies to roughly 1 : 2.6 : 2.6, meaning it carries about two and a half times as much P₂O₅ and K₂O as N.
- 20-5-10 simplifies to 4 : 1 : 2, meaning nitrogen is the dominant component.
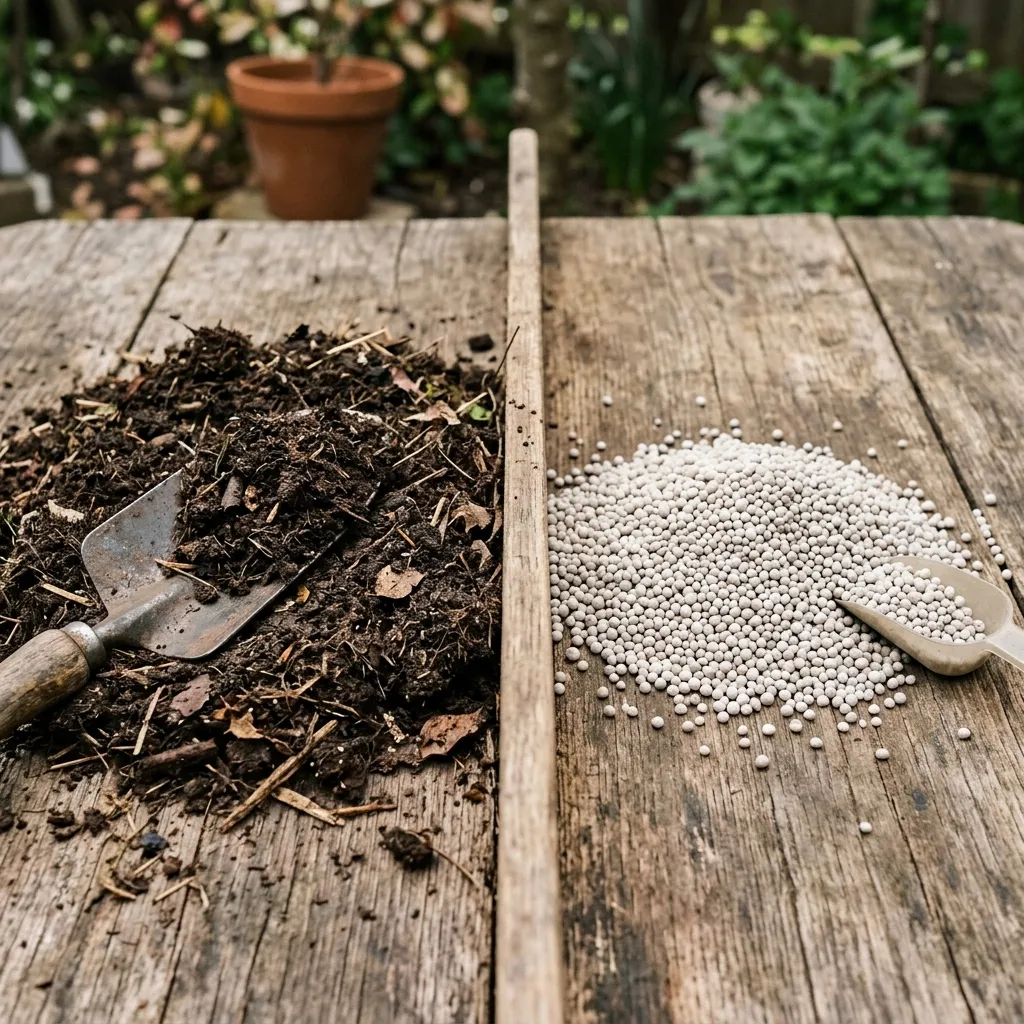
This distinction matters when comparing products. Two fertilizers can share the same ratio and still behave very differently in practice because one is several times more concentrated than the other. The ratio tells you about proportions; the analysis tells you about concentration.
A Worked Example: Comparing Concentration
Because the numbers are percentages by weight, you can calculate how much of each labeled nutrient a given mass of product contains. This example is only meant to show how concentration works; it is not an application rate.
| Product | N in 100 g | P₂O₅ in 100 g | K₂O in 100 g |
|---|---|---|---|
| 10-10-10 | 10 g | 10 g | 10 g |
| 19-19-19 | 19 g | 19 g | 19 g |
| 20-20-20 | 20 g | 20 g | 20 g |
| 10-26-26 | 10 g | 26 g | 26 g |
| 20-5-10 | 20 g | 5 g | 10 g |
Reading across the table, 100 g of 20-20-20 contains twice the labeled N, P₂O₅, and K₂O of 100 g of 10-10-10. Put differently, delivering the same amount of nitrogen from 20-20-20 takes only about half the product mass. That is why gardeners should never assume that a scoop of one fertilizer equals a scoop of another, and why the product label, not the ratio, sets the application rate.
The same logic shows why the differences between products with similar numbers are smaller than they look. 19-19-19 and 20-20-20 differ by about 5% in labeled concentration, which is a modest gap compared with the twofold gap between 10-10-10 and 20-20-20.
Balanced vs. Unbalanced NPK Analyses
A balanced fertilizer has equal numbers across all three labeled values, such as 10-10-10, 19-19-19, or 20-20-20. An unbalanced analysis, such as 10-26-26 or 20-5-10, contains different proportions of the three primary nutrient components.
Neither category is automatically better. Plants do not take up nutrients in equal amounts, so a balanced product is not necessarily a match for what a plant uses. Likewise, an unbalanced analysis is not a specialty treatment that works for every plant of a given type. The appropriate analysis depends on the plant, crop, growing medium or soil, environmental conditions, and nutrient requirements.
Comparing Common NPK Analyses
10-10-10
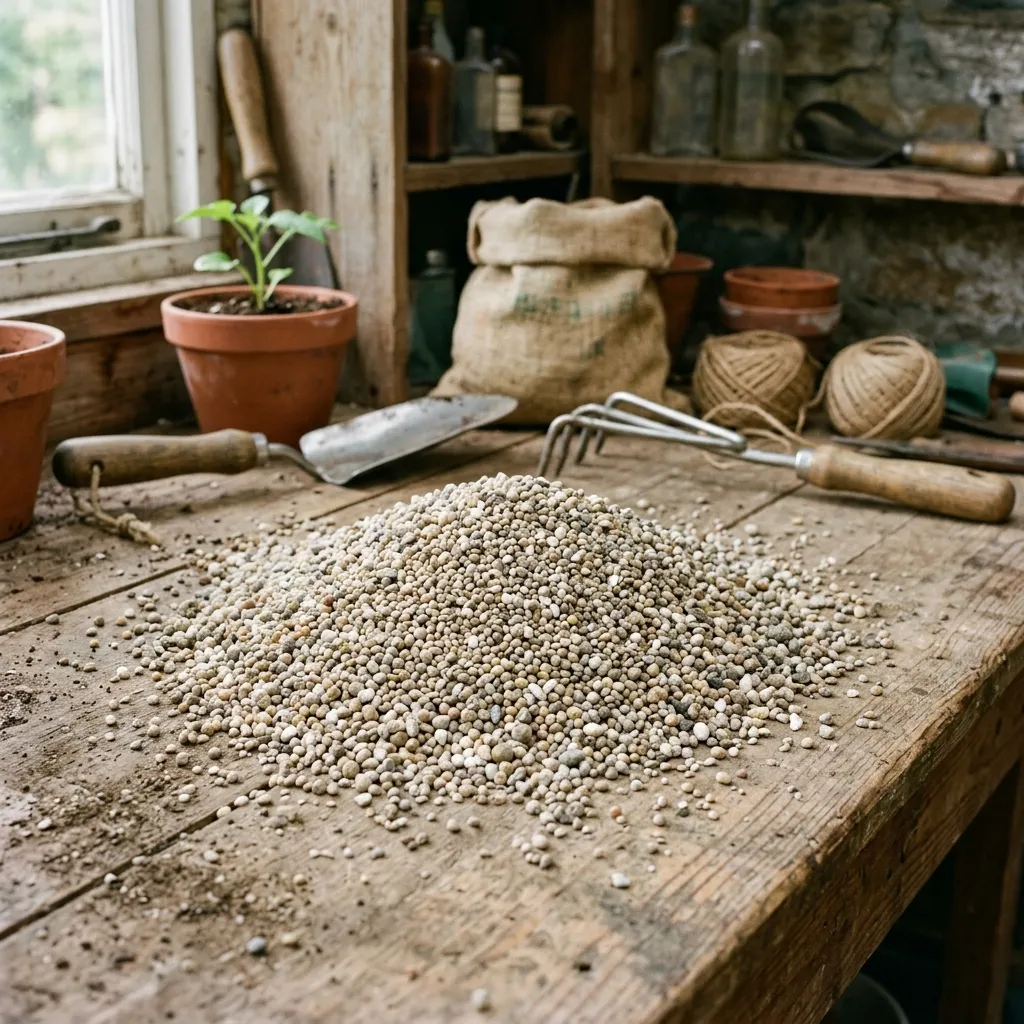
10-10-10 is a balanced analysis with equal labeled percentages of N, P₂O₅, and K₂O. It is commonly sold as a granular, general-purpose product. It may be used when that nutrient profile matches the plant's requirements and the product label supports the intended application. Because it is relatively low in concentration, it is often seen as a more forgiving starting point than highly concentrated soluble products, though label directions and application method still govern safe use.
NPK 19-19-19 and NPK 20-20-20
Both NPK 19-19-19 and NPK 20-20-20 are balanced analyses and are frequently formulated as water-soluble powders or liquids for use in solution. At the same product mass, 20-20-20 supplies a slightly greater percentage of each labeled primary nutrient component than 19-19-19. This is a concentration difference, not evidence that one analysis is universally better.
These products may also differ in nitrogen source, presence of micronutrients, and salt content. Two bags that both read 20-20-20 are not necessarily interchangeable, so check the full guaranteed analysis on each label.
When changing between products, use each product's label directions rather than assuming that the same grams, teaspoons, or milliliters will provide an equivalent application.
10-26-26
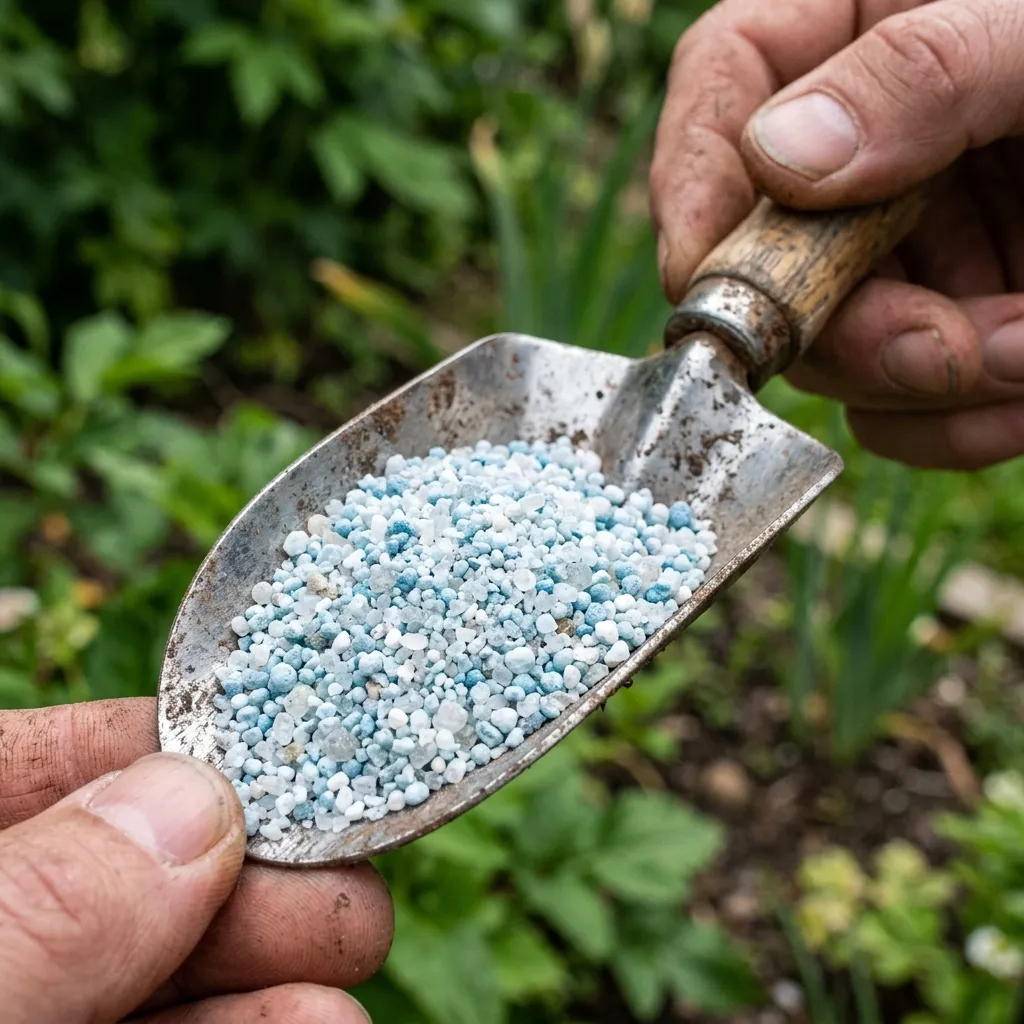
10-26-26 contains proportionally less nitrogen and more phosphate and potash than a balanced 10-10-10 analysis. It is often described as a complex fertilizer used in particular crop programs, but the ratio alone does not establish that a plant needs additional phosphorus or potassium, or that the product should automatically be introduced at flowering. Where soil or growing-medium phosphorus is already adequate, adding more phosphate offers no guaranteed benefit.
20-5-10 and Similar Higher-Nitrogen Analyses
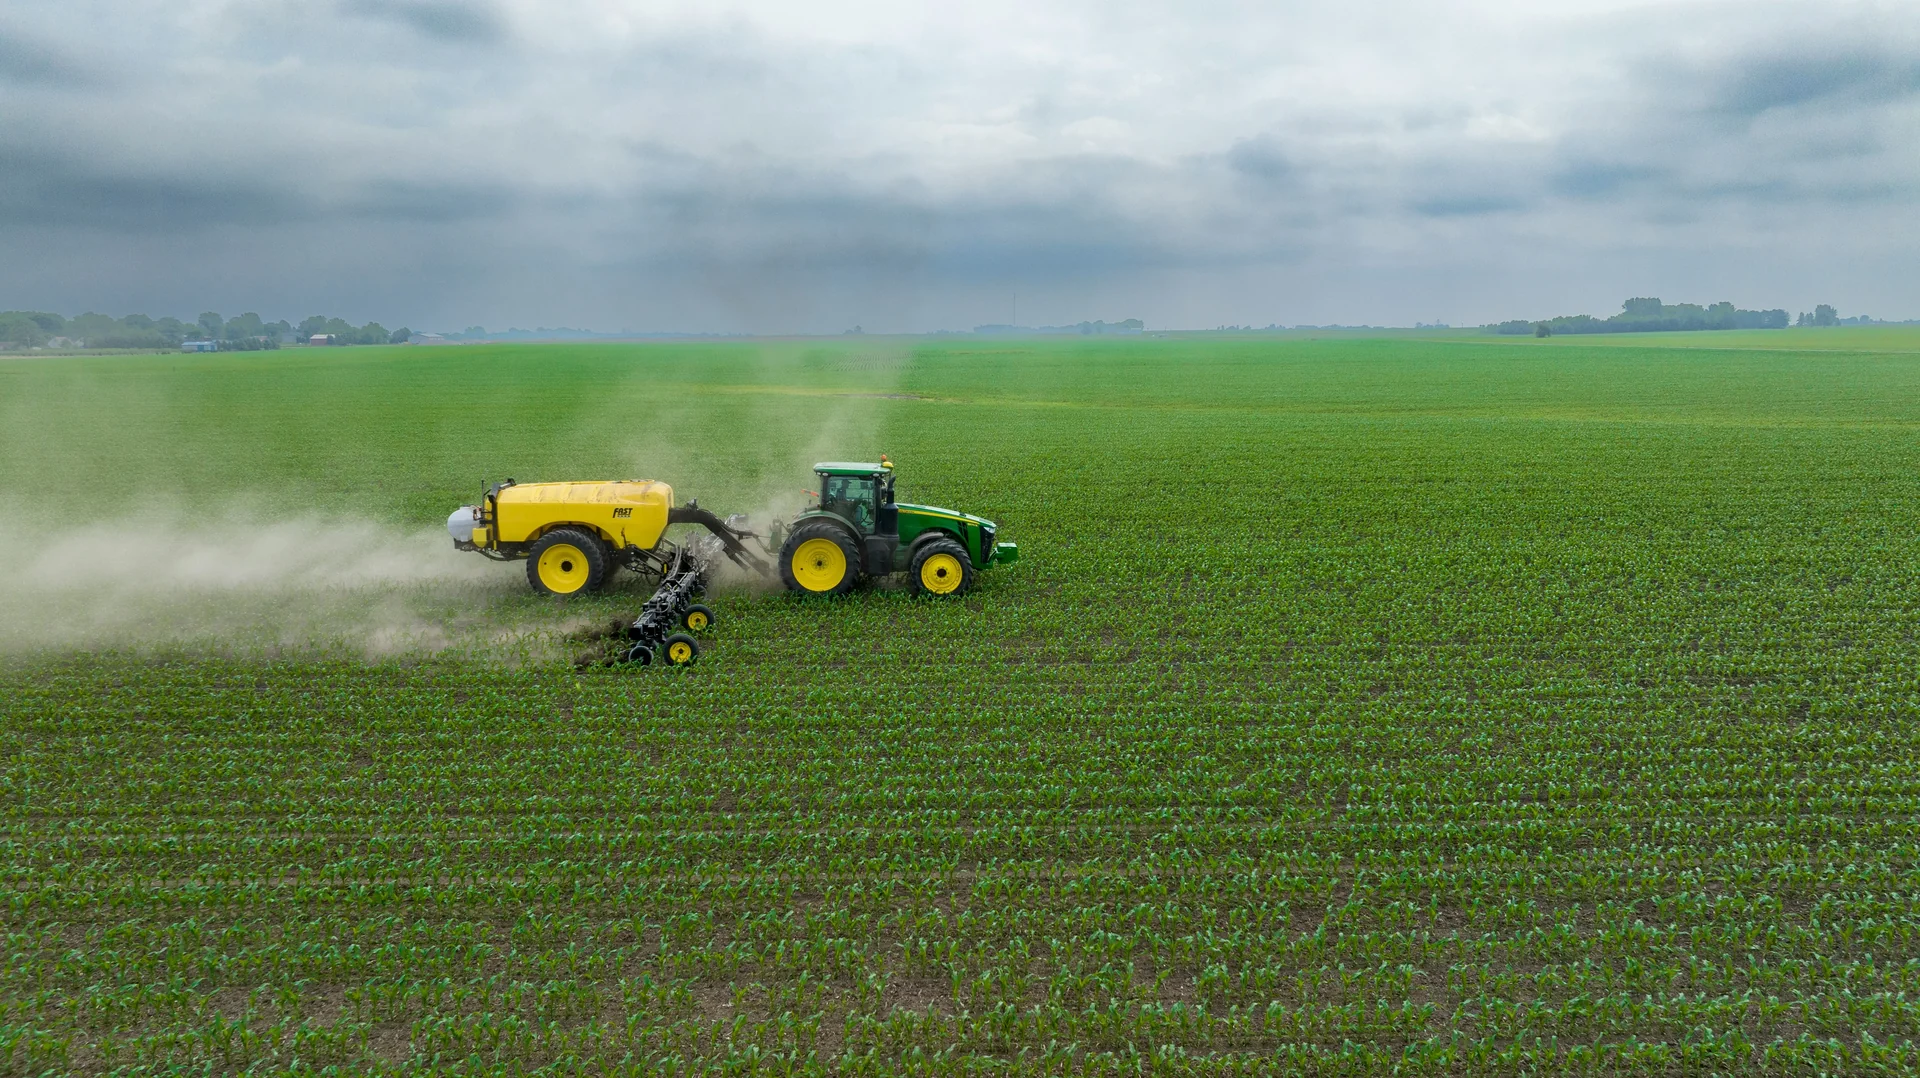
Products with relatively more nitrogen than phosphate or potash are commonly used in situations where leafy growth is a priority, including some turf programs. The appropriate analysis and application rate depend on the grass or plant, growing conditions, nutrient status, and product label.
How to Read a Fertilizer Label Beyond the Three Numbers
The NPK numbers are only one part of the label. Before comparing or switching products, look for the following:
- Guaranteed analysis: Lists the minimum percentages of each nutrient. It may include additional nutrients such as calcium, magnesium, sulfur, iron, zinc, manganese, boron, copper, and molybdenum.
- Nitrogen sources: Nitrogen may be listed as nitrate, ammoniacal nitrogen, urea, or a combination. These forms behave differently in the growing medium and can affect how quickly nitrogen becomes available.
- Product form: Granular, water-soluble powder, liquid concentrate, and slow-release products are applied differently and release nutrients at different speeds.
- Directions for use: Application rate, dilution, frequency, timing, and which plants or situations the product is intended for.
- Cautions: Warnings about application to dry soil, contact with foliage, storage, and use on sensitive plants.
Micronutrients and secondary nutrients are not reflected in the three headline numbers, so two products with identical NPK values can still differ in the overall nutrient package they provide.
Why P₂O₅ and K₂O Are Not Elemental Phosphorus and Potassium
Fertilizer labels report phosphate as P₂O₅ and potash as K₂O for historical and regulatory reasons. Those figures are not the same as the percentage of elemental phosphorus (P) or potassium (K) in the product. As a rough guide, P₂O₅ is about 44% elemental phosphorus and K₂O is about 83% elemental potassium.
For example, a fertilizer labeled with 20% P₂O₅ contains roughly 8.7% elemental phosphorus. This conversion matters when comparing a fertilizer label against soil test results, research recommendations, or plant tissue guidelines that report elemental values. Always confirm which form a recommendation is using before comparing it with a product label.
How to Choose Between NPK Ratios
- General growth: A balanced analysis may be appropriate when it matches the plant's nutrient requirements.
- Vegetative growth: Consider the plant's actual nitrogen requirement rather than automatically selecting the highest first number.
- Flowering and fruiting: Do not assume that flowering automatically requires a high-phosphorus fertilizer. Select an analysis based on the plant's nutrient requirements and applicable recommendations.
- Lawns and turf: Nitrogen is often an important nutrient for turf growth, but the appropriate analysis should reflect grass species, soil conditions, season, and local recommendations.
- Container plants: Nutrients can accumulate as salts in potting media over time, so the concentration of the product and the way it is applied matter as much as the ratio.
A Step-by-Step Way to Compare Two Fertilizers
- Identify the goal. Decide whether you are correcting a suspected deficiency, maintaining growth, or simply comparing products.
- Check plant requirements. Look up what the specific plant or crop needs rather than relying on a generic category such as "flowering plant."
- Consider the growing medium. Soil test results, when available, show whether phosphorus, potassium, or pH are already limiting or adequate.
- Compare full labels. Look at the analysis, nitrogen sources, micronutrients, product form, and directions.
- Compare nutrient amounts, not volumes. Use each label's directions and, when needed, calculate the amount of the target nutrient each product supplies.
- Start conservatively and observe. Follow the label and monitor the plant's response before changing the program.
Factors That Matter as Much as the NPK Numbers
- Soil or media pH: Nutrient availability changes with pH, so a plant can show deficiency symptoms even when the nutrient is present.
- Light and temperature: A plant that lacks light or is growing in poor temperatures cannot use additional nutrients effectively.
- Watering and drainage: Overwatering, underwatering, and poor drainage can each mimic nutrient problems.
- Root health: Damaged or rotting roots limit nutrient uptake regardless of what is applied.
- Release rate: Quick-release and slow-release products supply nutrients on different timelines, which changes how often feeding is needed.
- Salt buildup: Repeated feeding without flushing or adequate leaching can raise salt levels in containers and stress roots.
Why NPK Numbers Matter When Comparing Concentration
Higher NPK numbers indicate a higher percentage of the labeled nutrient components by weight. For example, 20-20-20 contains approximately twice the labeled percentage of each primary nutrient component as 10-10-10. This does not mean that the higher-analysis product is better; it means that equal masses of the two products do not supply equal amounts of labeled nutrients.
When changing products, compare the product label, nutrient analysis, application method, and target nutrient amount. Do not transfer a dilution rate from one fertilizer to another simply because the NPK ratios appear similar.
Avoiding Common Mistakes When Switching Fertilizers
A common mistake is treating the NPK ratio as if it were an application recipe. The three numbers describe nutrient analysis, while the product label provides the manufacturer's application directions for that formulation.
Another mistake is assuming that a higher phosphorus number automatically improves flowering or that a higher nitrogen number automatically causes excessive foliage. Plant response depends on the complete growing environment and nutrient status.
- Switching by volume: Swapping a scoop of one product for a scoop of another without checking concentration.
- Chasing the biggest number: Assuming a more concentrated fertilizer will produce faster or better results.
- Fertilizing a stressed plant: Feeding a plant that is dry, waterlogged, or root-damaged, which can add stress rather than relieve it.
- Ignoring the rest of the label: Overlooking nitrogen form, micronutrient content, or product-specific cautions.
- Stacking products: Using several fertilizers together without accounting for the combined nutrient and salt load.
Before switching products, identify the plant's nutrient requirement, read the new product label, compare the analyses, and calculate an equivalent nutrient amount only when the necessary information is available.
When a Soil or Tissue Test Is Worth Doing
If a plant is underperforming and you are unsure whether nutrients are the cause, a soil or growing-medium test can be more informative than changing fertilizer analysis by guesswork. Testing is particularly useful for lawns, vegetable beds, and perennial plantings, where the same soil is fed year after year and nutrient levels can drift up or down. A test also shows soil pH, which affects whether nutrients are available to the plant at all.
For potted plants, symptoms such as pale new growth, leaf edge browning, or stunted growth can come from light, watering, salt buildup, or roots rather than the fertilizer ratio. Correcting the underlying condition usually matters more than adjusting the NPK numbers.
Common NPK Analyses at a Glance
| NPK Analysis | Relative Nutrient Profile | Typical Use Context |
|---|---|---|
| 10-10-10 | Equal N, P₂O₅, and K₂O percentages | General-purpose applications where a balanced analysis fits the plant's nutrient requirements |
| 19-19-19 | Equal N, P₂O₅, and K₂O percentages at a higher concentration than 10-10-10 | General-purpose or soluble fertilizer applications where the product label and plant requirements support this analysis |
| 20-20-20 | Equal N, P₂O₅, and K₂O percentages at a slightly higher concentration than 19-19-19 | General-purpose soluble fertilizer applications where the product label and plant requirements support this analysis |
| 10-26-26 | Lower N with substantially higher P₂O₅ and K₂O relative to N | Applications where the plant or crop nutrient requirements specifically call for this type of analysis |
| 20-5-10 | Higher N relative to P₂O₅ and K₂O | Applications such as turf management where a relatively higher nitrogen supply is appropriate |
Troubleshooting & Diagnostics Guide
1 Lush green leaves but few flowers or fruit
Diagnosis: Reduced flowering or fruiting can have many causes, including plant maturity, light, temperature, water management, genetics, and nutrient balance. High nitrogen is only one possible factor.
Treatment: Check the plant's growing conditions and nutrient requirements before changing fertilizer. Do not assume that increasing phosphorus or switching to a bloom-oriented analysis will solve the problem.
2 Slow or weak growth despite regular feeding
Diagnosis: Possible causes include inadequate light, root problems, unsuitable temperature, water stress, nutrient deficiency, or an inappropriate fertilizer analysis.
Treatment: Check growing conditions and, where appropriate, soil or growing-medium nutrient status before changing the fertilizer ratio. If nitrogen is actually limiting growth, select a product and application rate appropriate to the plant and follow its label.
3 Fertilizer burn after switching products
Diagnosis: Different products can contain different nutrient concentrations, and applying the same mass or volume of a more concentrated product can increase nutrient and salt exposure.
Treatment: Compare the product analyses and label application rates before switching. Do not assume that equal grams, teaspoons, or milliliters of different products are nutritionally equivalent.
4 Plant shows no improvement after changing to a higher-phosphorus fertilizer
Diagnosis: A higher-phosphorus analysis does not correct problems caused by light, temperature, water, root health, plant maturity, or nutrients other than phosphorus.
Treatment: Reassess the plant's actual limiting factor instead of continuing to increase fertilizer concentration.
Glossary of Terms
- NPK Ratio
- The three numbers on a conventional fertilizer label representing the percentage by weight of total nitrogen (N), available phosphate expressed as P₂O₅, and soluble potash expressed as K₂O.
- Balanced Fertilizer
- A fertilizer analysis in which the three labeled NPK numbers are equal, such as 10-10-10, 19-19-19, or 20-20-20.
- Bloom Booster
- A marketing or product category commonly used for fertilizers with relatively higher phosphorus and/or potassium compared with nitrogen. The term does not guarantee increased flowering.
- Concentration
- The amount of labeled nutrient contained in a given quantity of fertilizer. For example, 20-20-20 has approximately twice the labeled percentage of each primary nutrient component as 10-10-10.
- P₂O₅
- The phosphate value used in conventional fertilizer analysis and labeling. It is not the same as reporting elemental phosphorus as a percentage.
- K₂O
- The potash value used in conventional fertilizer analysis and labeling. It is not the same as reporting elemental potassium as a percentage.
Frequently Asked Questions
What is the difference between 10-10-10 and 20-20-20 fertilizer?
Which NPK ratio is best for houseplants?
Which NPK ratio is best for lawns?
What does 10-26-26 fertilizer do?
Can I substitute one NPK ratio for another?
Is a higher NPK number always better?
What NPK ratio is best for flowering plants?
Is 19-19-19 stronger than 10-10-10?
Is 20-20-20 stronger than 19-19-19?
Does a higher phosphorus fertilizer make plants flower more?
Can I use 10-26-26 during vegetative growth?
How do I compare fertilizer doses when the NPK ratios are different?
Explore More